Calice Capital
Connecting good businesses to capital
Connecting good businesses to capital
About
Calice Capital LLC is a New York–based advisory and quantitative systems firm. We build end-to-end systematic equity trading platforms for serious investors and trading operations — and we help growth-stage businesses build the financial and strategic foundation they need to attract capital.
Our trading infrastructure work covers the full stack: historical data pipelines, multi-factor fundamental and relative strength screening, technical momentum filters, ATR-based position sizing, Interactive Brokers execution integration, and portfolio monitoring — all built on PostgreSQL, Python, and Streamlit. Our principal, Randall Thomas, CMT, brings 20+ years of database architecture experience and a Chartered Market Technician designation to every engagement.
Our advisory work is equally hands-on: we build the financial models, craft the business plans, and prepare the investor-ready materials that turn a compelling idea into a funded company.
What We Do

We work alongside founders and management teams to organize their business for investment. From projected financial statements built in Excel to polished investment memoranda and executive summaries, we create the materials that make investors say yes.
We design and build production-grade systematic equity trading platforms from the ground up. Our own platform — covering 14,000+ US equities and ETFs with 20 years of history — is the proof of concept. If you have the methodology and need the infrastructure, we can build it for you.
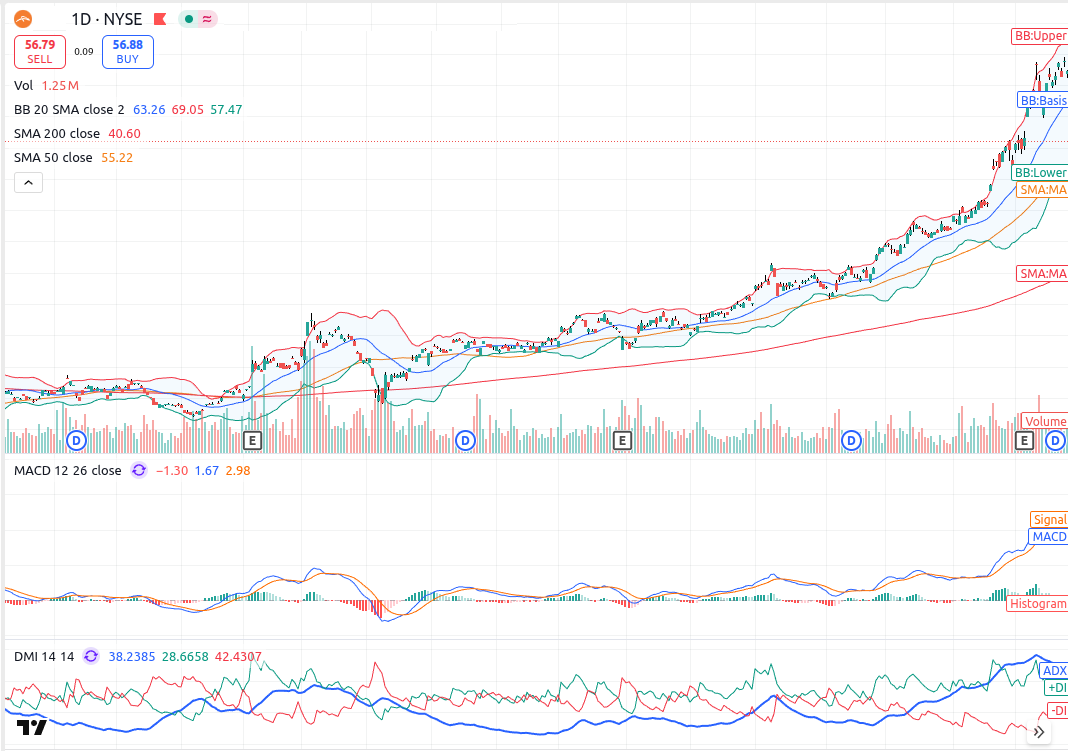
Built, Not Described
Every component shown below runs in production on live market data. Built on PostgreSQL, Python, and Streamlit — no third-party platforms, no vendor lock-in.
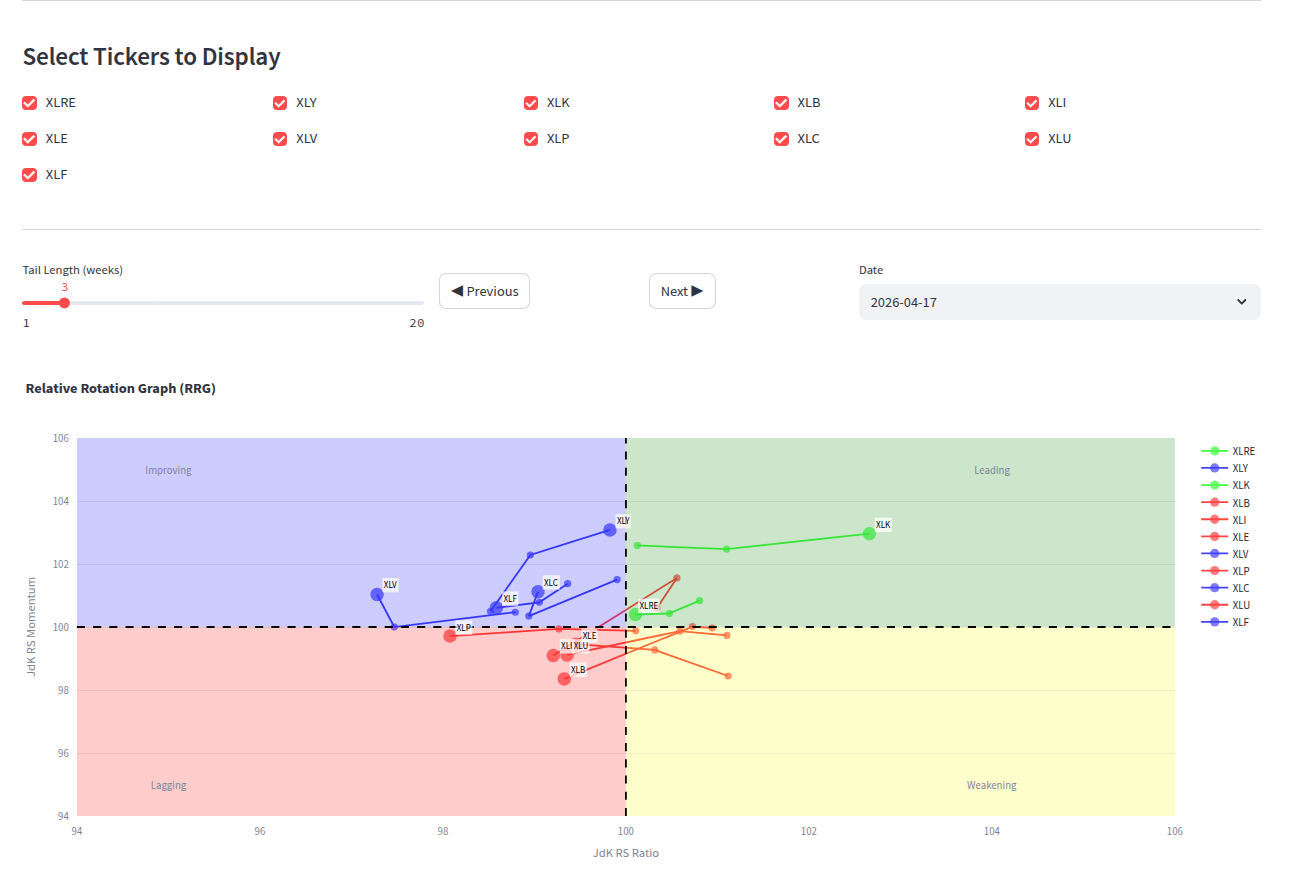
Sector rotation mapped across the JdK RS-Ratio and RS-Momentum axes. Interactive tail length and date controls. Identifies leading, weakening, lagging, and improving sectors in real time.
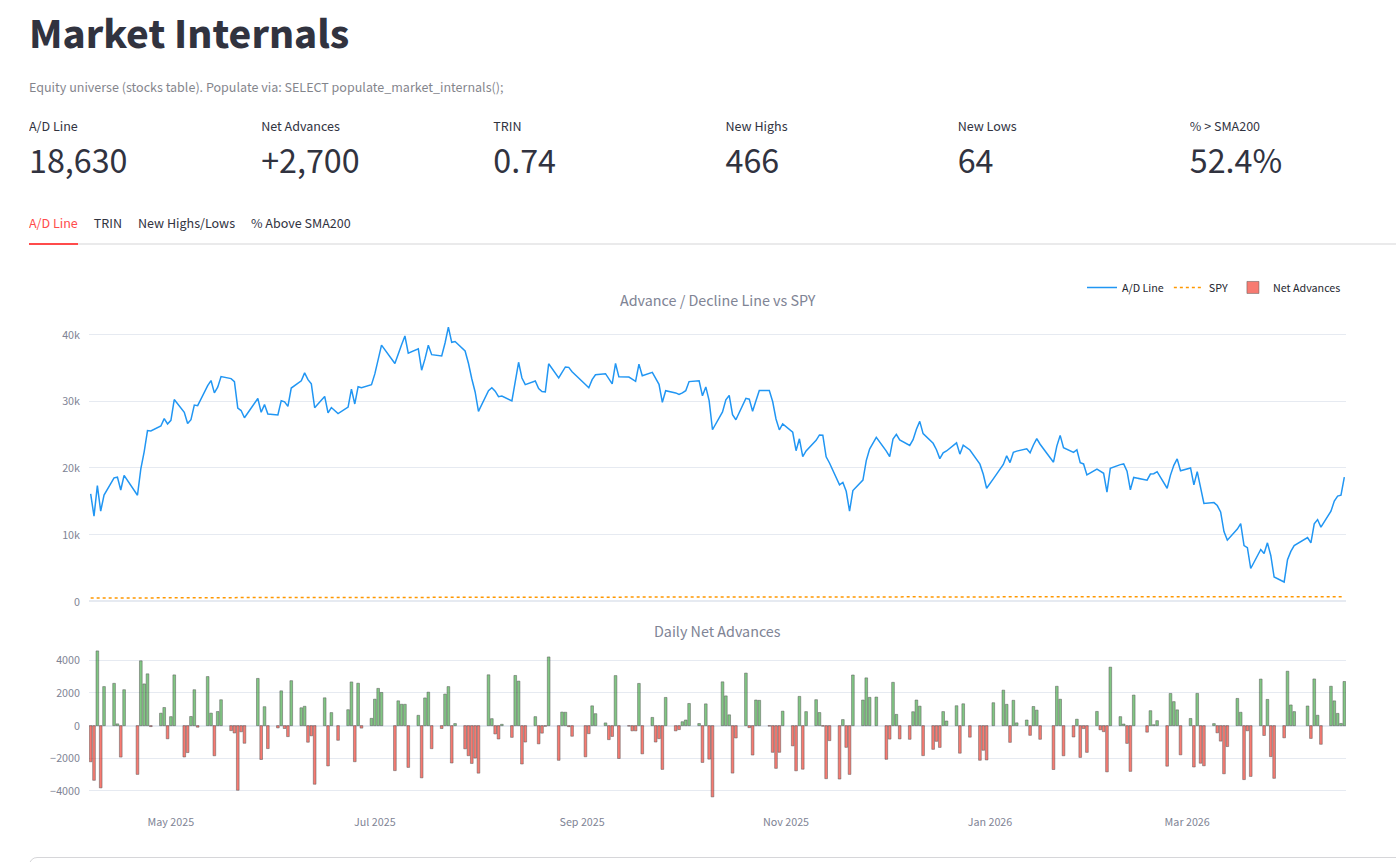
Advance/Decline Line, TRIN/Arms Index, New Highs/Lows, and % Above SMA-200 — all computed nightly from the full equity universe and displayed with daily net advances histogram.
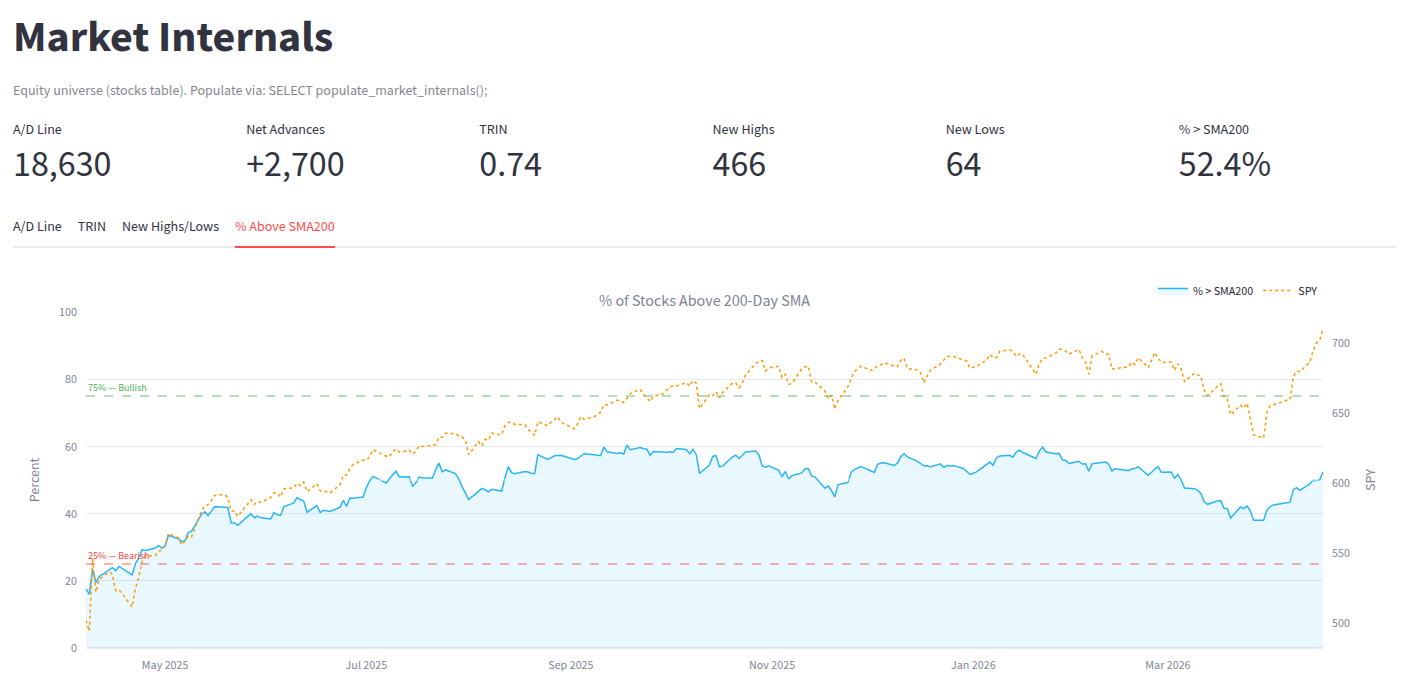
Tracks the percentage of the equity universe trading above their 200-day moving average, overlaid against SPY. Bullish and bearish threshold lines provide at-a-glance regime context.
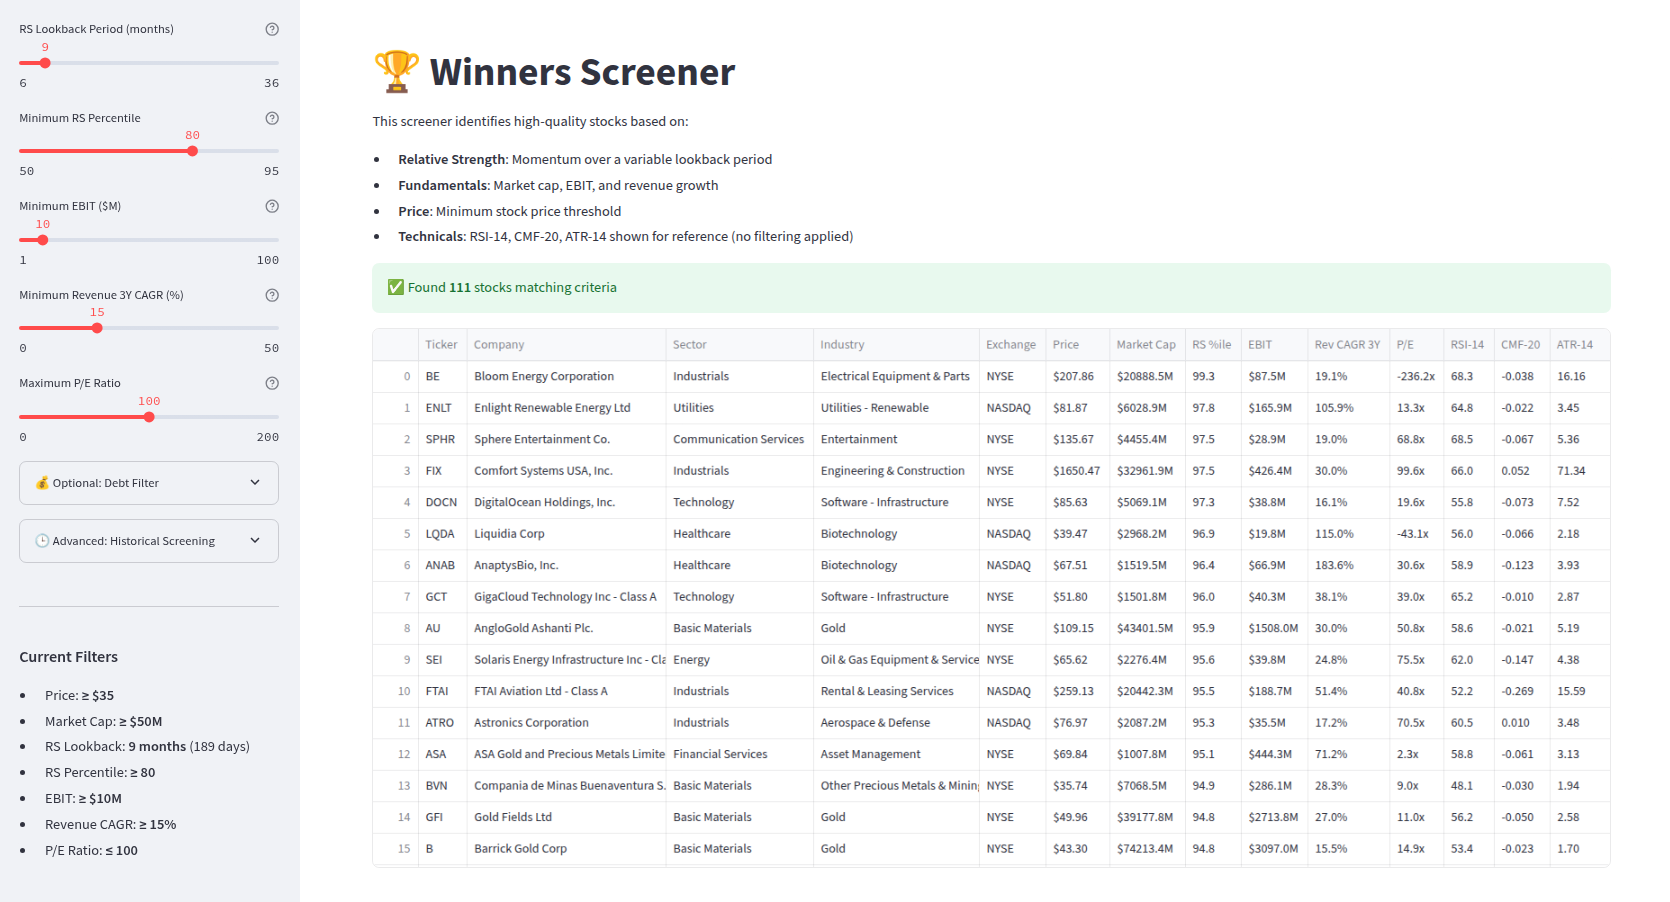
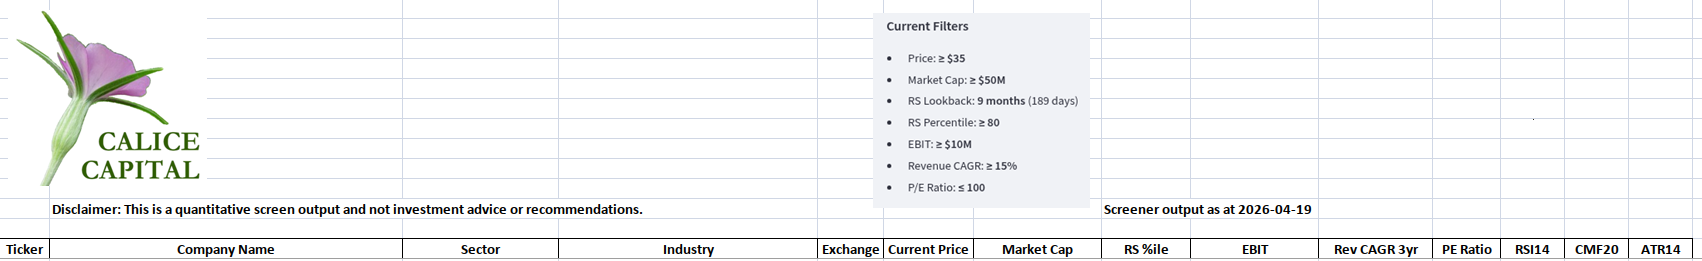
Multi-factor screen across 14,000+ tickers: relative strength percentile, EBIT, revenue CAGR, P/E ratio, and price threshold — all configurable via interactive sliders. Runs against 20 years of PostgreSQL history.
Every Sunday
Each week we run our Stage 1 fundamental and relative strength screen across the full US equity universe and publish the results as a free downloadable Excel file. Updated every Sunday. No registration required.
The screen filters for stocks with top-quintile relative strength, positive EBIT, strong revenue growth, and reasonable valuation — a pre-qualified universe for your own technical analysis and due diligence.
This screen output is provided for informational and research purposes only. It does not constitute investment advice or a recommendation to buy or sell any security. Past screening results are not indicative of future performance. Always conduct your own due diligence.
“The best investment is in the tools of one’s own trade.”
— Benjamin Franklin
Get in Touch
Whether you have a specific advisory requirement, an interest in discussing systematic investment, or would simply like to connect, we’d like to hear from you.
Use the inquiry form and we’ll respond within one business day
New York City